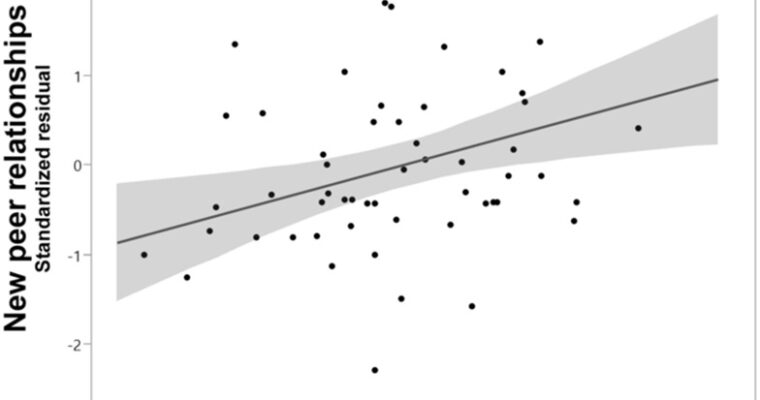
Learn Scatter Plot and Best Fitting Lines
A scatter plot is a set of data points that shows the correlation between the variables. As the name depicts, these plots take a set of confusing, scattered data and turn it into something that makes sense. The best fitted lines within a scatter plot …
